Microport
Presenting rhythm
Select Test EGMS along the bottom tabs.
Select EGM along the top tabs.
Hit Start to view rhythm and stop when done.

Percentage paced
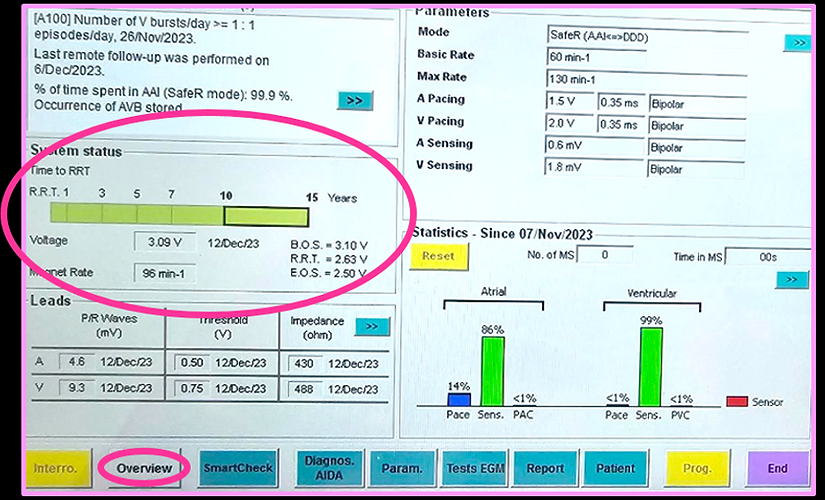
Select Overview along the bottom tabs.
Battery status is displayed on the screen


Percentage pace data can also be found by selecting Diagnostic AIDS along the bottom tabs.
Select PM along the top tabs.
Select statistics on the right hand side

Battery
Select Overview along the bottom tabs.
Battery status is displayed on the screen


Battery data can also be found by selecting Diagnostic AIDS along the bottom tabs.
Select PM along the top tabs.
Select battery curve on the right hand side

Leads
Select Diagnostic AIDA along the bottom tabs.
Select PM along the top tabs.
Select lead mesurements on the right


To measure a manual impedance, select Test EGMS along the bottom tabs.
Select impedance test along the top tabs.
Hit Start to get current impedance data

Sensing and ULR
Select Test EGMS along the bottom tabs.
Select sensitivity tests along the top tabs.
Choose the appropriate mode and rate.
Hit Start to view rhythm and stop when done.

Thresholds
Select Test EGMS along the bottom tabs.
Select Pacing threshold tests along the top tabs.
Choose appropriate mode and rate.
Note: only asynchronous modes available
Hit Start to view rhythm and stop when done.

Observations
Depending on the device model, there are limited observations/diagnostic information available.
For heart rate data select Test diagnostic AIDA along the bottom tabs.
Select PMalong the top tabs.
Select Heart rate curve on the right.
Note: this device only provides a 24hr view of heart rates

This device shows a ~6 month trend of heart rate, % paced and arrhythmia episodes.

For arrhythmia episodes select diagnostic AIDA along the bottom tabs.
Select Arrhythmias along the top tabs.
Each episode can be viewed by selecting the magnify glass


Arrhythmia information may be found on the overview screen

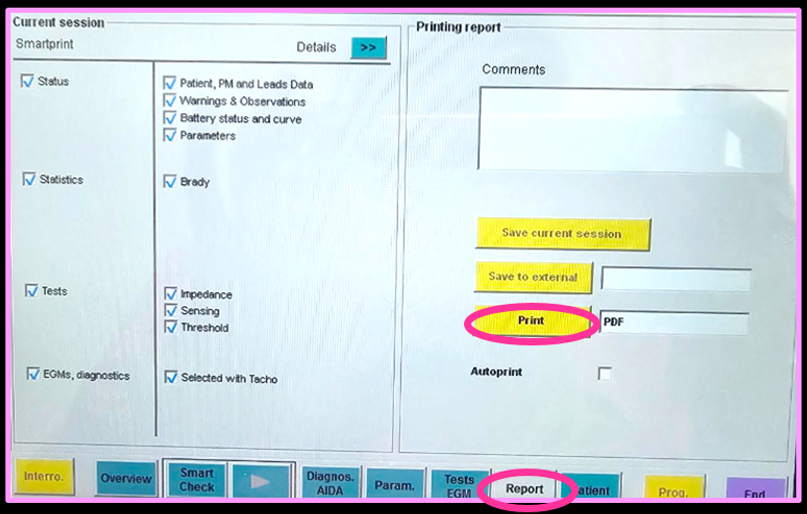
Program
Select Param. along the bottom tabs

Select Report along the bottom tab.
Ensure all necessary reports are selected.
Press print
Printing EGMs during the session is also suggested (e.g, threshold testing - hit the camera icon at the top of the programmer to save the image).
Ensure arrhythmias are ticked to be printed