top of page


Threshold trend interpretation
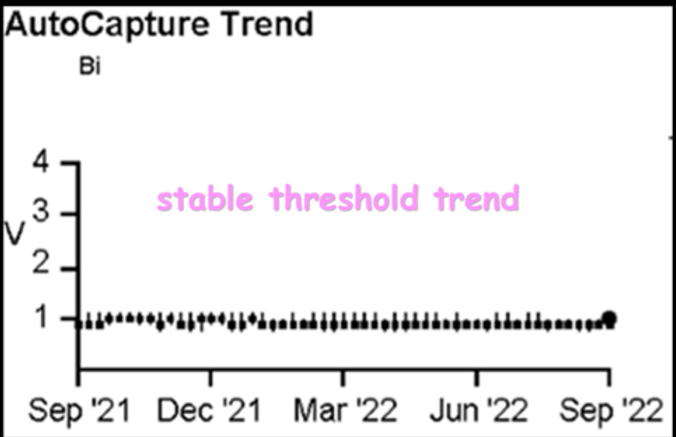
When a lead is stable and the automatic threshold testing are performing appropriately, the threshold trend should appear to be stable and consistent with manual threshold testing.
Threshold trend interpretation: About
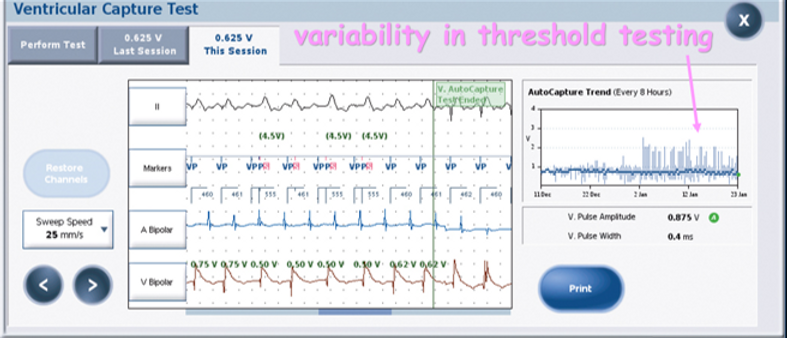
Variability in threshold results will appear on a graph like the one below. This may reflect true variation in threshold or inaccuracy in automatic threshold testing. Due to the degree of variability, and the overwhelming consistency with the average value, this trend is most likely consistent with inaccurate threshold testing. Automatic adjustments of output should be programmed off (preferably to monitor), or in the case of an Abbott device, a threshold set up test may need to be performed again.
Threshold trend interpretation: About
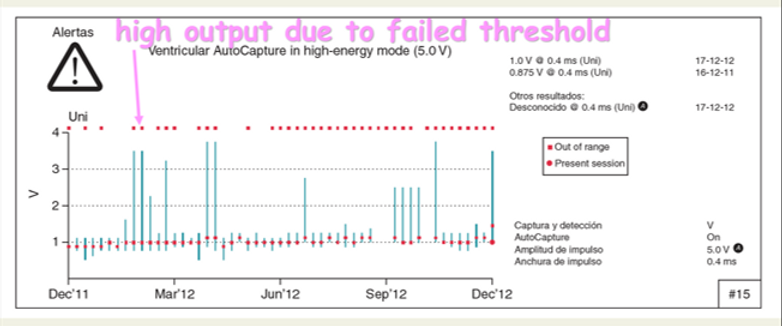
When a automatic threshold test is failed, the device defaults output to high output (5V @ 0.4ms) for safety reason. Based on the threshold trend below, it appears that similarly to the above example, the automatic threshold testing algorithm is inaccurate. The automatic output adjusting feature should be turned off, to monitor or a new threshold test should be performed if applicable.
Threshold trend interpretation: About
Threshold trend interpretation: About
bottom of page